

100+ Architecture Statistics for 2024: Trends, Technology, & More
Oct 8, 2024

In this comprehensive blog, we explore the most critical architecture statistics for 2024, covering the latest architecture statistics on employment, sustainability, market projections, and trends on advancements in technology that are shaping the industry. This report provides a data-driven look into what the future of the Architecture industry holds.
Architecture Pay and Salaries: How Much Do Architects Make?
- As of 2024, the average annual pay for an Architect in the United States is $128,756 a year. That works out to be approximately $61.90 an hour. This is the equivalent of $2,476/week or $10,729/month (ZipRecruiter).
- Architects made a median salary of $82,840 in 2022 (U.S. News & World Report)
- The best-paid 25% made $105,190 in 2022, while the lowest-paid 25% made $65,220. (U.S. News & World Report)
- Compared to other professions in their respective countries, architects in Europe and America make roughly 65% more money (Rethinking The Future).
Annual Salaries for Occupations in the Architecture Industry: How Much Do Architects Make a Year?
- Landscape Architect: $79,320 (U.S. Bureau of Labor Statistics)
- Interior Designer: $69,958 (Indeed)
- Urban and Regional Planners: $85,940 (U.S. Bureau of Labor Statistics)
- Architectural Designer: $70,851 (Indeed)
- Architect: $128,756 (ZipRecruiter)
- Industrial Designer: $81, 861 (Indeed)
- Architectural Project Manager: $115,938 (salary.com)
- Proposal Writer: $77, 618 (Indeed)
- Proposal Manager: $99,490 (ZipRecruiter)
Pay Compared to Similar Occupations

Here’s how pay compares to similar occupations (U.S. Bureau of Labor Statistics):
- Architectural and Engineering Managers: $165,370
- Civil Engineers: $95,890
- Construction and Building Inspectors: $67,700
- Construction Managers: $104,900
- Drafters: $62,530
- Industrial Designers: $76,250
- Landscape Architects: $79,320
- Surveying and Mapping Technicians: $48,940
- Surveyors: $68,540
- Urban and Regional Planners: $81,800
Architecture Growth Rate
- The U.S. architectural services market size was valued at $73.01 billion in 2023 and is projected to grow at a CAGR of 4.2% from 2024 to 2030 (Grand View Research).
- The architect field will grow 5% by 2032, faster than the average for all occupations (Reading Eagle).
- Architects who specialize in or use sustainable design are expected to especially be in demand (U.S. News & World Report).
- The urban planning segment is growing at a registered CAGR of 6.5% between 2023 and 2032 (Precedence Research).
How Many Architecture Firms in the U.S.?
- There are 73,313 businesses in Architecture in the U.S. (IBISWorld).
- The percentage of architecture businesses has grown at a CAGR of 1.6 % between 2019 and 2024 (IBISWorld).
Architecture Employment Rate Statistics
- A 4.8% employment growth for architects is projected between 2022 and 2032 (U.S. News & World Report).
- In that period, an estimated 6,000 jobs should open up (U.S. News & World Report).
- The average Architect business in the U.S. has 3 employees (IBISWorld).
- 91% of Architecture Firms in the U.S. have under 19 working employees (Business of Architecture).
- That percentage is even higher in the UK, Australia, New Zealand, Canada, and many other countries (AIA).
- Of approximately 19,000 American Institute of Architects (AIA) member-owned firms in 2019, about 60% had fewer than five employees, 6.5% had 50 or more employees, and 2.5% had 100 or more employees (AIA).
- Architecture firms with 100+ employees account for 30% of national employment and total billings (AIA).
- Firms with 50+ employees represent over half of employment in private practice and almost half of total revenue, despite smaller firms making up the majority (AIA).
- Around 75% of architecture firms have five employees or fewer (Worldmetrics.org).
- Architectural services employment is projected to grow by 3% from 2020 to 2030 (Learn.org).
- The states with the highest employment levels for Architecture are (U.S. Bureau of Labor Statistics):
- California: 15,370 architects
- New York: 10,970 architects
- Texas: 8,110 architects
- Illinois: 5,470 architects
- Florida: 5,380 architects
How Many Architects in the U.S.?
- There are 121,368 employees in the Architecture industry in the U.S. (NCARB).
How Many Architects in the World?
- There are somewhere between three and four million architects in the world (Architizer).
Architecture Company Size per Employees
- In the U.S., small architectural firms (1-9 employees) make up 75.2% of all the architectural firms in the country, mid-sized firms (10-49 employees) make up 18.5% of firms, and large firms (50+ employees) make up 6.3% of architectural firms (Wonder).
- 2.5% of firms have above 100 employees (Wonder).
- 60% have less than five employees on their payrolls (Wonder).
- In 2020, the average firm size in the U.S. was 12 employees (AIA).
What Are the Largest Architecture Firms in the World?
- The largest architecture firm in the world – Gensler, employs 6,000 professionals (Gensler).
- The second largest architecture firm is HDR, which employs over 12,000 professionals (HDR).
- The third largest architecture firm is Nikken Sekkei in Japan, which employs 1,257 Japan Registered 1st Class Architects and 163 Japan Registered 2nd Class Architects (Nikken).
Hiring Predictions and Job Outlook for Architects
- Approximately 8,200 new openings for architects are projected each year, on average, over the decade (Reading Eagle).
- A significant number of these openings are anticipated to arise from the need to replace workers who transition to other occupations or leave the workforce, such as those retiring (U.S. Bureau of Labor Statistics).
- Architect employment is projected to grow by 5% from 2022 to 2032, a rate faster than the average for all occupations (OpenAsset).
- 52.2% of surveyed firms are planning on hiring next year mostly for those with skills in Design Experience (34.8%) and secondly in Marketing/Business Development Experience (13%) (Ventiques).
How Many Licensed Architects Are in the U.S.?
- In 2022, there were nearly 120,000 licensed architects across 55 U.S. jurisdictions (The Architect’s Newspaper).
- There were 35,621 candidates actively working on licensure (The Architect’s Newspaper).
In What Architecture Company Sectors Are Employees Working?
- Architects are 56% more likely to work at private companies in comparison to public companies (LinkedIn).
- Nearly 2 in 5 architecture firms (35%) are seeing an uptake in residential work coming in the new year (Monograph).
- Institutional projects accounted for 52% of architecture firms’ gross billings in 2019, making it the largest sector (Wonder).
- Residential projects made up 17.5% of total firm billings, with 45% of residential billings from single-family work and 39% from multifamily housing (AIA).
- K-12 education projects continued to trend upward and accounted for 14% of all firms’ gross billings in 2019, followed by college/university education projects (12%), and office projects (12%) (AIA).
- The shares of gross billings from both residential and commercial/industrial projects declined from 2017 to 2019, with multifamily residential projects seeing the largest decline (Wonder).
- Similarly, commercial/industrial firms’ billings were mostly split between office (26%), hospitality (18%), retail, food services, and warehouses (15%)(AIA).
- Institutional firms’ billings were primarily derived from K-12 education projects (24%), college/university education projects (20%), and healthcare projects (11%) (Wonder).
- The most common industries for architects are technology (34%), professional (19%), and finance (7%) (Zippia).
- Industrial projects are experiencing growth and institutional sectors like healthcare remain strong (BSA).
Where Architects Work (On-Site vs. Hybrid vs. Remote)
- Firms are now more open to flexible work arrangements, which have become essential in attracting and retaining top talent in a highly competitive market (OpenAsset).
- In 2020, 39.1% of architects were working in a hybrid model (Monograph).
- In 2020, 34.8% of architects were working fully remotely (Monograph).
- In 2022, it was estimated that a substantial 76.6% of firms will be choosing the hybrid model for their architecture firm (Monograph).
- The number of firms that are operating remotely dropped significantly to only 9.9% this year (Monograph).
- More than a third of architecture firms are letting their employees decide whether to work from the office or work remotely (Monograph).
- With only 21% of firms intending to work fully in the office, hybrid work will be the norm in the Architecture industry moving forward (Monograph).
- In 2020, only 13% of architecture firms remained working in the office (Monograph).
- For the last two years, architectural practices have remained largely 72% of firms afforded full-time or nearly full-time remote work options for employees in 2020 (Architect Magazine).
- 46% of AEC professionals said their firm will employ a hybrid workforce in 2022 (OpenAsset).
Architecture Regional Demographics
- Architects are most in demand in Atlanta, GA (Zippia).
- Virginia is the best state for architects to live in (Zippia).
- The best cities for architects are San Francisco, CA, and New York, NY (Growthitect).
- The highest concentration of architect jobs was found in the District of Columbia, with a location quotient of 3.60, and a mean annual wage of $115,230. Other states with significant job concentrations included Massachusetts, Colorado, and Washington (U.S. Bureau of Labor Statistics).
Where Do Architects Earn the Most?

The top paying states for architects, excluding landscape and naval, were (U.S. Bureau of Labor Statistics):
- California: Mean annual wage of $120,780
- District of Columbia: Mean annual wage of $115,230
- Wyoming: Mean annual wage of $114,810
- Alaska: Mean annual wage of $111,150
- Nevada: Mean annual wage of $110,780
Architecture Statistics by State
Based on the states where architects earn the most, here are some statistics on most of those states (IBISWorld):
- California:
- Market Size: $9.7 billion
- Number of Businesses: 11,642
- Industry Employment: 35,279
- Wyoming:
- Market Size: $86.7 million
- Number of Businesses: 207
- Industry Employment: 352
- Alaska:
- Market Size: $118.8 million
- Number of Businesses: 123
- Industry Employment: 352
- Nevada:
- Market Size: $462.5 million
- Number of Businesses: 532
- Industry Employment: 1,264
Global Architecture Statistics
- The global architectural services market was valued at $360.8 billion in 2022 and is forecasted to reach approximately $549.6 billion by 2032. This growth represents a compound annual growth rate (CAGR) of 4.3% between 2023 and 2032 (Precedence Research).
- North America region will lead the global architectural services market during the forecast period 2023 to 2032 (Precedence Research).
- The U.S. accounted for 19.4% of the global architectural services market (Grand View Research).
Gender in the Architecture Industry: Is Architecture a Male-Dominated Field?
- In 1958, 1% of registered architects were women. By 1988 that number had risen to 4% (Peacock Architects).
- Fast forward to 2022, 23.3% of all architects are women, while 76.7% are men (Peacock Architects).
- Since 2023, more than 1,600 AIA members have self-identified as LGBTQIA+ (AIA).
- The LGBT representation among architects is approximately 15% (Zippia).
- When compared to similar professions, digital cartographers have an LGBT representation of 11%, while exterior designers and environmental engineering interns show around 8-9%. Hardware engineers report a 7.5% LGBT demographic, and manufacturing engineers and electronics repair technicians fall around 3-4% (Zippia).
Women in the Architecture Industry
- 27% of licensed U.S. architects are women (NCARB).
- Women accounted for 46% of emerging professionals on the path to licensure and 53% of architecture students working at firms (AIA).
- Over the past 5 years, women have consistently earned their licenses in less time than their male peers (Architectural Record).
- In 2019, women made up 21% of principals/partners, showing a gap in leadership roles compared to overall staff representation (AIA).
- In 2019, 37% of all architecture staff were women, 46% were emerging professionals at firms on a path toward licensure, and 53% of architecture students working at firms (AIA).
- In 2017, only 3 architecture firms out of the 100 biggest architecture firms were run by female CEOs. (dezeen).
- For the first time ever, women account for over a quarter of AIA’s total membership at 26.8% (AIA).
- Women hold only 20% of the leadership positions in architecture firms (David Brown International).
- In 2022, women architects earned 92% of what men earned (Zippia).
- Women earn 92¢ for every $1 earned by men (Zippia):
- Male Income: $85,968
- Female Income: $79,033
Demographics in Architecture Related to Race and Diversity
- In 2023, among architects of color (NCARB):
- 7% identified as Asian
- 6% identified as Latino
- 2% identified as Black or African American
- White candidates remain the most represented group, making up 60% of all licensure candidates (NCARB).
- Hispanic or Latino candidates represented 19% of the candidate population in 2023, a 3 percentage point increase since 2019 while Asian candidates made up 17% of the total candidate population, and Black or African American candidates made up 6%—a 1 percentage point increase over the past 5 years for both groups (NCARB).
- 47% of licensure candidates identified as POC in 2023 (Architectural Record).
- In 2023, 1 in 5 architects identified as a person of color (NCARB).
- In 2023, POC comprised 19% of the total architect population—a 3 percentage point increase compared to 5 years ago, and 1 percentage point more than last year (NCARB).
- In 2023, the average white candidate took 12.9 years to complete the licensure path. In comparison, Asian and Black candidates took 13.3 years, about four months longer, while Hispanic or Latino candidates took the longest at 13.5 years, six months longer than their white counterparts (NCARB).
- Among members of the American Institute of Architects (AIA):
- The percentage of reported underrepresented racial and ethnic groups grew 5.7 points between 2013 and 2023 to 17.9%.
- 33.3% of associate members self-identify from an underrepresented race and/or ethnicity, which is at a higher rate than overall membership and up 12.4 points from 2013.
- The most commonly spoken foreign language among architects is Spanish, spoken by 41.6%. French is the second most popular, with 12.9% of architects speaking it, followed by Italian, spoken by 6.0% (Zippia).
Race by Gender in Architecture
- Black or African American men and women are among the most underrepresented groups in architecture, making up approximately 1% of the architect population each (NCARB).
- 33% of licensure candidates were white men, while Asian women and Latino men were the most represented groups among POC, each making up 10% of the population (NCARB).
- In 2023, Asian and Hispanic or Latino men made up 7% and 11% of the new candidate pool, respectively, compared to 11% and 10% for Asian and Latina women (NCARB).
- Asian and Latino men are the most represented groups among architects who identify as a person of color, making up 4% of practitioners each (NCARB).
- 62% of all U.S. architects in 2023 were white men, reflecting the continued dominance of this demographic (CareerExplorer).
- Asian women represent the largest group among POC licensure candidates, at 9% (ArchDaily).
Age of Architects
- The average architect age is 45 years old (Indeed).
- The average age of retirement for Architecture is 65 (Indeed).
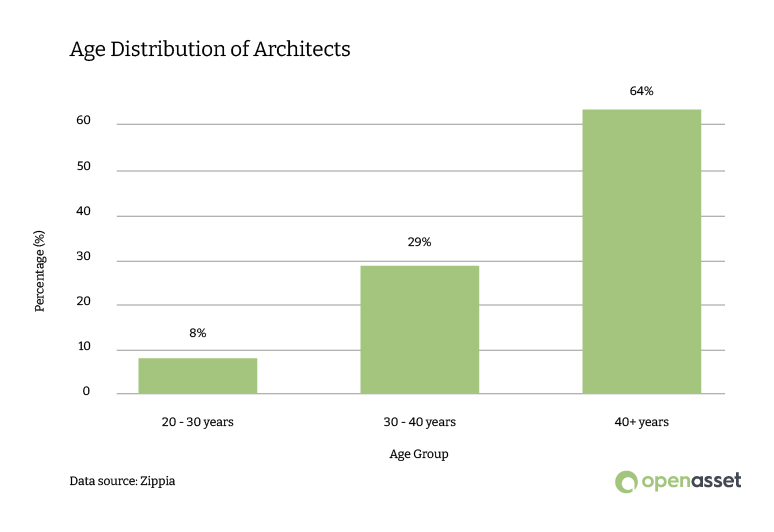
- 64% of Architects are 40+ years old or older, 29% are between the ages of 30-40 years, and 8% are between 20-30 years old (Zippia).
- Among members of the American Institute of Architects (AIA):
- In 2023, the median member age was 51, about where it has been since 2013.
- The percentage of members above the age of 60 has increased by 4.5 points since 2013, while those aged 20–39 have increased by 3.2 points.
- The percentage of members in the 40–59 age range, which contains our current median, has shrunk by 3.3 points since 2013.
Architecture Education
Here’s an outlook and recent trends in architecture education:
Degrees Awarded
- Here are the percentages of the types of degrees held by architects (Zippia):
- 67% have a bachelor’s degree
- 21% have a master’s degree
- 6% have an associate’s degree
- 2% have a diploma
- 4% have other degrees
- The Architecture industry relies heavily on 6,000 graduates of architectural programs each year (BSA).
Top Majors for Architecture Professionals
- The most popular majors for staff architects are architecture, environmental design, and architectural technology (Zippia):
- Architecture: 64%
- Environmental Design: 8%
- Architectural Technology: 4%
- Urban Planning: 4%
Common Colleges for Staff Architects
- Here are the most common colleges for staff architects in the U.S., based on their resumes (Zippia):
- University of Illinois at Chicago: 8.6%
- New York Institute of Technology: 8.6%
- Kansas State University: 7.8%
Accredited Programs in Architecture
- There are 175 accredited programs in architecture across 139 institutions in the U.S. (NAAB).
- 118 (67%) are Master of Architecture (M.Arch.) programs, 56 (32%) are Bachelor of Architecture (B.Arch.) programs, and 1 (1%) is a Doctor of Architecture (D.Arch.) program (NAAB).
- In AY 2022-2023, 30,068 students were enrolled in NAAB-accredited programs (Architecture Careers Guide).
- 62% (18,371 students) were enrolled in Bachelor of Architecture programs, while 38% (11,697 students) were enrolled in Master of Architecture and Doctor of Architecture programs (Architecture Careers Guide).
Architecture Student Demographics
- 45% of enrolled students were male, 53% were female, and 0.5% identified as non-binary (NAAB).
- Race/Ethnicity for B.Arch. Programs: 38% were White, 24% Hispanic/Latino, 11% Asian, and 6% Black/African American (NAAB).
- Race/Ethnicity for M.Arch./D.Arch. Programs: 41% White, 16% Hispanic/Latino, 8% Asian, and 7% Black/African American (NAAB).
- There is a relatively high number of people who were born in Iran who hold Architecture and Related Services degrees (3.79 times more than expected) (Census).
- The most common country of origin by total numbers for non-U.S. students earning a degree in this field is Mexico (7,771 degree recipients). (Census).
Architect Wage Gap by Degree Level
- Architects with a Master’s degree earn more than those without, at $88,584 annually (Zippia).
- With a Bachelor’s degree, architects earn a median annual income of $87,240 compared to $86,905 for those with a Doctorate (Zippia).
Tuition Costs for Architectural Degrees
- Tuition fees for undergraduate architecture programs average $19,000 annually at public institutions and $34,000 at private ones, with graduate programs often costing more (IllustrArch).
- Books, studio supplies, and software add around $2,000 to $4,000 per year to these totals (IllustrArch).
- A powerful laptop or desktop, optimized for architecture work, can cost between $1,500 and $3,000 (IllustrArch).
Architecture Licensing and Examination Fees
After completing an architecture degree, licensure is essential.
- The Architect Registration Examination (ARE) consists of several divisions, each costing $235 as of 2023. The total examination fees amount to approximately $1,645 (IllustrArch).
- Candidates must also cover application fees, which vary by state, and often range from $100 to $300 (IllustrArch).
- Maintaining a professional license requires ongoing continuing education courses and renewal fees every few years, typically costing $150 to $300 annually (IllustrArch).
- African American and Latino candidates are 5-6% less likely to receive firm support toward the cost of the exam (Archinect).
- African American women are 10% less likely to say their firm would pay for the exam (Archinect).
- African American candidates are also 17% more likely to say college debt impacts exam affordability and 14% more likely to say personal debt impacts exam affordability (Archinect).
- African American women are 10% more likely than white women to say college debt impacts exam affordability (Architect Magazine).
Architecture’s Economic Impact
- Architects across the U.S. have experienced a decline in business conditions over the past year. Many are pessimistic about the health of their firms, the broader architecture industry, and the overall U.S. economy (Archinect).
- Inflated material and labor expenses, and years of strong demand, are keeping the cost of construction high, discouraging clients from engaging architects on new projects (Archinect).
- Although the rate of change has stabilized for the past year, a recent analysis shows that the price of inputs to construction is still 41% higher than it was in February 2020 (ABC).
- The Skyscraper Effect: Coined by economist Andrew Lawrence in 1999, the ‘skyscraper index’ shows that the tallest skyscrapers correlate with an ensuing economic downturn in that region (ex. Empire State Building and Burj Khalifa) (Rethinking The Future).
- Cities like Bilbao and Dubai use iconic architecture to boost their economies (Rethinking The Future).
- The Bilbao Effect: The transformative economic and social impact of the Guggenheim Museum in Bilbao, Spain, revitalized the city, which had been struggling with high unemployment and poverty. Today, the Guggenheim is one of the most visited museums in the world, symbolizing how iconic architecture can boost tourism and stimulate local economies (Snaptrude).
Architecture Industry Revenue
- Industry revenue has grown at a CAGR of 0.5 % over the past five years, to reach an estimated $259.6bn in 2024 (IBISWorld).
- The Global Architectural Services industry’s revenue is expected to expand at a CAGR of 2.7% to $292.4 billion over the five years to 2028 (IBISWorld).
- Global revenue for architectural design services is expected to reach $325 billion by 2029 (IBISWorld).
- Architecture firms spent an average of 1.51% of their total revenue on marketing in 2020 (Gitnux).
- Revenue for architects slipped at a CAGR of 0.1% to an estimated $55.3 billion over the past five years, including an estimated 2.0% boost in 2024 alone (IBISWorld).
- Asia Pacific region accounted for a revenue share of around 37% in 2022 (Yahoo Finance).
- By service type, the construction and project management segment has generated a revenue share exceeding 34.5% in 2022 (Yahoo Finance).
- By end-use, the industrial segment accounted for 46% of revenue share in 2022 (Precedence Research).
Net Revenue/Full-Time Equivalent (FTE) for Architects
- The top quartile of architecture firms achieve a Net Revenue/FTE of $201,350 (Scribd).
- The median Net Revenue per FTE across 180 architecture firms included in the data was $152,264 (Monograph).
- The bottom quartile of architecture firms has a Net Revenue per FTE of $112,497 (Monograph).
Architecture Firm Fees
- In 2022, firms were optimistic about increasing fees— 3 out of 4 firms surveyed were planning to increase their fees (Monograph).
- Despite a decline in economic growth at the beginning of the pandemic, 90% of the surveyed firms didn’t change the way they charged per project in 2020 (Monograph).
- Beyond drawing up house plans and blueprints, architects cost between 5% and 15% for new construction management and between 12% and 20% for renovations (Forbes).
- Architect fees typically range between $100 and $250 per hour, though intern architects could charge as little as $50 per hour for consultations (Forbes).
- For the first time in over 80 years, the U.S. Department of Defense (DoD) will raise the statutory fee limits for architects involved in construction projects for the Army, Navy, and Air Force from 6% to 10% (AIA).
Architecture Firm Investment and Planning Strategies
- 40% of firms that meet or exceed their goals plan to invest in project management software next year, right behind design software at 49% (Matellio).
- Financial planning (54%), project management (46%), and task management (46%) are the top 3 processes that high-performing firms want to modernize with the use of technology (Matellio).
- 70% of architecture firms plan to invest more in technology in the next 12 months (ZipDo).
- 69% say their practice has not invested in AI research and development, and only 41% expect their practice to invest (RIBA).
- 70% of organizations report that their investments in enterprise architecture have increased (15.7% on average) and 97% of them are planning several significant investments in the next two years (Architecture & Governance).
Statistics on Marketing Your Architecture Firm
- A robust architecture digital marketing strategy can greatly improve a company’s brand awareness by up to 86% and boost credibility and trust by 75% (OpenAsset).
- 63% of AEC marketers say they struggle to manage the digital assets (images, brand material, videos, etc) they need to provide a consistent brand image across multiple channels (OpenAsset).
- In a survey, over 68% of the High Growth AEC firms rated their SEO maturity at a mid or high level (Hinge Marketing).
- 34.9% of surveyed firms also want to hire for marketing/business development, compared to 13% last year (Monograph).
- Implementing the right marketing technology (MarTech) stack can empower your firm to win more business (OpenAsset).
- Many architecture firms have seen increases in marketing budgets, with some reports indicating that 66% of firms are looking to modernize their financial planning and marketing strategies. This includes investments in proposal activity, hit rates, and marketing systems (Market Reports).
- A significant challenge for firms is maintaining consistency in client experiences. Only 13% of architecture firms have a formalized client onboarding process (Market Reports).
- 63% of high-performing firms consider client satisfaction to be the most important KPI for measuring success (Monograph).
- Over 50% of AEC websites fail on SEO (AECx).
- Less than 10% of AEC companies utilize “lead magnets” (AECx).
- Research has found that a firm that is growing quickly and rising in its space is likely to submit over 50% more proposals than average firms in the market, which is where robust digital marketing is necessary (AECx).
- Available AI technology can automate approximately 25% of each marketer’s day, including your sales and proposal staff (OpenAsset).
AEC Marketing Statistics From OpenAsset’s 2024 State of AEC Marketing Report
- Marketing teams are small relative to the size of the firms they support: 69% of participants reported their marketing team is fewer than 10 people.
- Onboarding new technology and workflows is difficult for small teams that do not have interns, project managers, or additional headcount to help assist with the implementation process.
- Thoughtful resource allocation and ongoing leadership support are vital for teams to overcome obstacles in AEC marketing workflow efficiency.
- When asked “What percentage of your team’s time is devoted to marketing strategy/brand-building?” the majority of respondents (35%) reported less than 25%, with 27% reporting that number to be less than 10%.
- The majority of respondents reported that less than 25% of their time is devoted to creating and writing new content (40%).
- When asked, “What marketing channels/activities do you engage with to build brand awareness and other pipeline generation?” The top 5 activities selected were:
- Social Media (94%)
- Industry Awards (77%)
- Trade Show / Conference sponsorship (74%)
- Conference speaking (43%)
- Traditional Media (e.g. Architectural journals, press releases, etc.) (69%)
- Top challenges when implementing marketing campaigns:
- Measuring the ROI of digital marketing efforts (39%)
- Budget constraints (35%)
- The second tier of challenges included:
- Lack of internal leadership support (27%)
- Keeping up with the latest digital marketing trends and technologies (24%)
- Lack of internal expertise (23%)
- The largest callouts of important software for branding building and content creation in AEC marketing were:
- Adobe Creative Suite/Cloud (24%)
- InDesign (14%)
- Canva (12%)
Architecture Technology Statistics
- The fastest-growing AEC firms are more digitally mature with more than 50% of the firms automating or managing their main processes with technology (Hinge Marketing).
- A near-majority (47%) of British architects believe their digital maturity is around where most are, suggesting a willingness to adopt new digital tools that are already of proven value (RIBA).
- Architecture firms in the U.S. spent over $2.8 billion on software and technology in 2020 (Gitnux).
- 65% of architecture students believe technology will drastically change the field (RIBA).
- Onboarding new technology and workflows is difficult for small teams that do not have interns, project managers, or additional headcount to help assist with the implementation process (OpenAsset).
Technology Advancements and New Tools
- 54% of architects expect their practice to use AI in the next two years (RIBA).
- 50% of architects use robotics for fabrication and construction (ScienceDirect).
- 30% of architecture firms have implemented blockchain technology for project management (ZipDo).
- 60% of architects believe that machine learning can improve design efficiency (ScienceDirect).
- 50% of architecture firms have implemented digital twin technology (ZipDo).
- 60% of architects leverage machine learning for predictive energy modeling (ZipDo).
- Cloud computing adoption in architecture firms has increased by 41% in the past two years (WifiTalents).
- 85% of architects believe that digital fabrication technologies are reshaping the industry (WifiTalents).
Artificial Intelligence (AI)
- AI adoption is in its infancy, with just 2% of practices using it on every project (RIBA).
- In the next two years, 54% of architects expect their practice to use AI (RPC).
- 41% of UK architects are already using AI on at least the occasional project (RPC).
- 57% believe AI will improve efficiency in the design process (RIBA).
- 49% think better digital tools, including AI, are necessary to meet the increasing complexity of buildings – which includes climate adaptations and smart building technology (Facilitate Magazine).
- The adoption rate of AI in architecture firms has increased by 22% since 2018 (WifiTalents).
- 80.5% of AEC professionals plan to use digital tools, including AI (OpenAsset).
- Nearly 50% of architects believe AI can build better buildings than humans can (RevitGods).
- 49% expect AI to enhance accuracy in modeling and simulations while a significant minority expect AI will be integrated into bid creation and project management (41%) and will come to enhance the accuracy of their specifications (40%) (RIBA).
- 20% of architects are very concerned that AI could replace human architects in the future (RevitGods).
Statistics About Architecture and Building Information Modeling (BIM)
- 60% of BIM-using architects report using BIM on over half of their projects, with a total of 89% forecast by 2024 (Autodesk).
- 80% of architecture firms use project management software with integrated BIM capabilities (ZipDo).
- 84% of architecture firms plan to invest in BIM technology within the next year (Worldmetrics.org).
- The architectural BIM software market is expected to grow at a CAGR of 13.6% from 2021 to 2028 (LinkedIn).
- BIM can reduce project errors by up to 90% (ZIGURAT).
Statistics About Architects Using 3D Printing
- 50% of architects incorporate 3D printing in their design process (ZipDo).
- 65% of architecture and engineering firms integrate 3D printing technology for model making (Raise3D).
- 60% of architects use 3D scanning technology for existing site documentation (ZipDo).
- 65% of architects use 3D scanning technology for heritage preservation projects (ZipDo).
- The 3D Printing Construction Market Size was valued at $36.71 million in 2023 and is expected to reach $20.56 billion by 2032, growing at a CAGR of 102% between 2024 and 2032 (SNS Insider).
- The “Dubai 3D Printing Strategy,” aims to have 25% of Dubai’s buildings 3D printed by 2030 (OpenAsset).
- The architectural 3D printing material market is expected to grow at a CAGR of 15.2% from 2021 to 2028 (Gitnux).
Smart Buildings and IoT
- 45% of architecture firms adopt Internet of Things (IoT) technology for smart building systems (ZipDo).
- IoT devices in buildings are predicted to exceed 75 billion by 2025 (SDSU).
- Over 1.5 billion IoT devices are expected in commercial buildings by 2025 (IoT Analytics).
- Smart architecture solutions are expected to drive significant growth in the architectural software market (LinkedIn).
- The global market for smart buildings is projected to reach $109.48 billion by 2026 (PR Newswire).
- The market for smart architectural glass is projected to reach $17.10 billion by 2033 (Nova One Advisor).
- The global market for smart sensors in buildings is expected to reach $10.4 billion by 2025 (WifiTalents).
Design Tools and Software
- The Architecture Design Software Market size was valued at $3.9 billion in 2023 and is estimated to register a CAGR of over 12% between 2024 and 2032 (GMT).
- More than 50% of artificial intelligence helps architects make conceptual designs (ResearchGate).
- 80% of architects use at least one type of design software (ZipDo).
- 65% of architects leverage 3D visualization software for interior design simulations (ZipDo).
- 70% of architectural visualization is now done using 3D rendering software (Cad Crowd).
- 50% of architects incorporate 3D printing in their design process (ZipDo).
- Over 70% of architects use virtual reality tools for design visualization (Autodesk).
- 43% of those using AI in some way always, often, or sometimes use it for parametric design (RIBA).
- 88% of architects believe that technology has increased the efficiency of their design process (WifiTalents).
- 25% of architecture firms have adopted AI-powered design assistants (ZipDo).
- 85% of architects believe AI can help architects create more innovative and creative designs (RevitGods).
Virtual and Augmented Reality

- 70% of architecture firms are now using virtual reality in some capacity (LinkedIn).
- 50% of architects employ virtual reality for immersive walkthrough experiences with clients (ZipDo).
- 70% of architecture firms use immersive virtual reality for client presentations (ZipDo).
- 48% of architecture firms use augmented reality for client presentations and pitches (WifiTalents).
- 35% of architects use VR and AR for building design (TechBullion).
- 30% of architecture firms utilize augmented reality for public engagement in urban planning projects (ZipDo).
- 50% of architects use augmented reality to create interactive experiences for project stakeholders (WifiTalents).
- 35% of architecture students are exploring the possibilities of mixed reality (ZipDo).
- The use of AR in architecture is set to grow by 64.5% from 2020 to 2025 (WifiTalents).
Digital Asset Management (DAM)
- The global digital asset management (DAM) market was valued at $3.96 billion in 2023 (Fortune Business Insights).
- The market is projected to be worth $4.59 billion in 2024 and reach $16.18 billion by 2032, exhibiting a CAGR of 17.0% during the forecast period (2024-2032) (Fortune Business Insights).
- Cloud-based collaboration tools are utilized by 62% of architecture firms for project coordination (WifiTalents).
- Teams that use proposal software have an average 45% proposal win rate (OpenAsset).
- 69% of organizations utilize an RFP tool or software (OpenAsset).
- Three-quarters of proposal teams that have fully integrated technology consistently complete their bids within the deadline (Responsive).
- 54% of AEC marketing professionals report that there is no system or process in place when it comes to internal requests for collateral like content (OpenAsset).
- 33% report that content requests are submitted according to guidelines set by the marketing team (which is not a centralized software system) (OpenAsset).
- AEC leaders should consider implementing a digital asset management (DAM) system for improved accessibility and organization across all contributors within AEC marketing (OpenAsset).
Architecture’s Role in Protecting the Climate and Environment
- The built environment is responsible for about 42% of annual global CO2 emissions (Architecture 2030).
- Of those total emissions, building operations are responsible for approximately 27% annually, while the embodied carbon of just four building and infrastructure materials – cement, iron, steel, and aluminum – are responsible for an additional 15% annually (Forbes).
- Energy-efficient building materials are gaining popularity, driving growth in the architectural coatings market (LinkedIn).
- Energy-efficient building technologies can reduce energy consumption by up to 50% (WifiTalents).
- 57% of architects expect to use AI to carry out environmental sustainability analysis (RIBA).
- 55% of architects incorporate responsive materials in facade systems for climate adaptability (ZipDo).
- 45% of architecture students implement computational fluid dynamics for environmental analysis (ZipDo).
- 230 energy savings (in EJ) to 2040 that could be gained by integrating smart controls and connected devices in new buildings. This would lower building energy consumption by 10% globally (GBA).
- By 2050, the AIA hopes to achieve net-zero emissions from the U.S. building sector (AIA).
- Choosing materials like aluminum sunshades can lower energy consumption by at least 10% as it reduces the need for frequent heating and cooling (Sharchs).
- Off-site construction contributes to a more environmentally friendly and resource-efficient building industry by resulting in 30% fewer emissions than onsite construction (New Civil Engineer).
- Client demands are the main drivers for sustainable design (45%) while environmental regulations (13%), and market transformation (10.5%) make up other drivers (BIMobject).
- IoT-enabled building management systems can cut energy consumption by up to 20%, making them integral to energy-efficient buildings (Medium).
- Smart lighting systems use sensors to adjust lighting based on occupancy, daylight availability, and time of day, reducing energy consumption by up to 35% (U.S. Department of Energy).
Sustainability in Architecture
- With 70% of the world’s population set to live in cities by 2050, AI has huge potential when it comes to sustainable urbanization (RIBA).
- 80% of AEC professionals feel it’s important to design something sustainable (BIMobject).
- 72% of architectural firms indicate that sustainability is a top priority for their clients (Worldmetrics.org).
- 35% of architects incorporate sustainable design technologies in their projects (ZipDo).
- 40% of architects use energy modeling software for sustainable design (AIA).
- Sustainable architecture is predicted to grow at a CAGR of 7.5% from 2021 to 2028 (Worldmetrics.org).
- The demand for green buildings is expected to grow at a rate of 14.3% through 2027 (Yahoo Finance).
- Building automation systems can lead to energy savings of up to 15-30% (Everest Mechanical).
- 57% of architects expect to use AI to carry out environmental sustainability analysis in the next 2 years (RIBA).
- The demand for sustainable architecture is expected to grow by 16.4% annually through 2027 (GlobalNewswire).
- The demand for sustainable building materials in the architectural industry is expected to increase by 6.7% annually through 2027 (Precedence Research).
- 28% (architects, engineers, contractors, owners, and investors from around the globe) report that most of their building projects qualify as green, and 42% anticipate being at that level within the next three years, expanding that group by 50% (OpenAsset).
The Future of Architecture
The Architecture industry is undergoing significant changes, propelled by technological innovations, growing diversity, and a focus on sustainability efforts. Staying informed about these architecture statistics and emerging trends is crucial as they transform how architects approach their work.
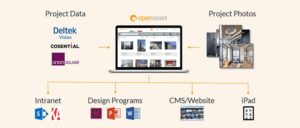
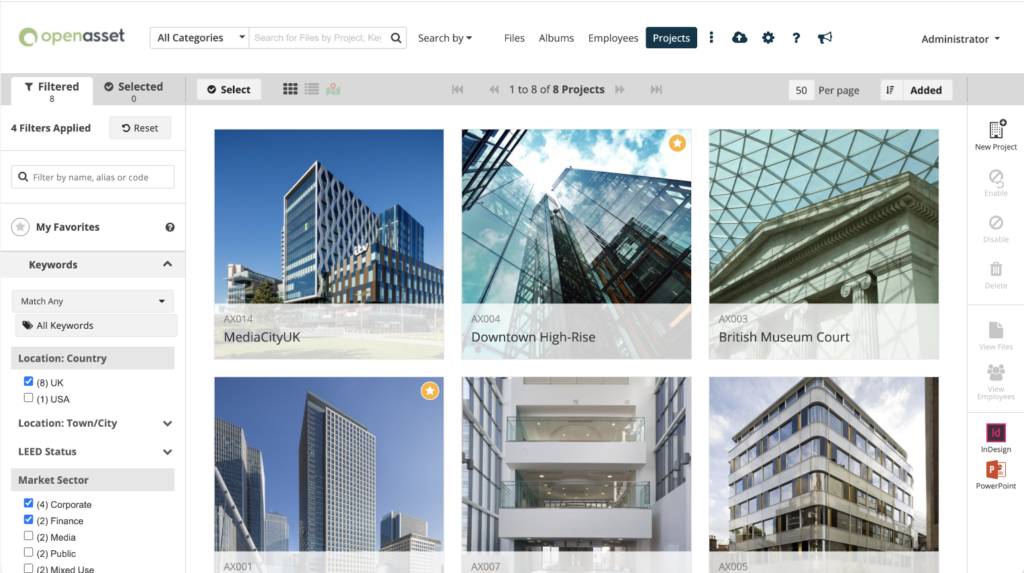
As the architecture field continues to innovate, adopting these trends will foster a future that is more diverse, sustainable, and efficient. Platforms like OpenAsset, a Digital Asset Management (DAM) system, play a pivotal role in this evolution, enabling firms to efficiently manage digital assets and streamline complex projects to create winning proposals, ultimately enhancing business growth.
Ready to prepare your architecture firm for the future?