


60 RFP Statistics: The Secrets To Winning More Bids

Jan 31, 2024
7 min

Understanding the dynamics of Request for Proposals (RFPs) is crucial for companies looking to expand their success and outshine competitors. Beyond calculating your RFP win rate, when you want to improve it, it’s important to understand the RFP statistics out there. However, the never-ending information available can become overwhelming.
In this blog, we’re focusing on the top 60 RFP statistics that will help you understand the bidding processes better so you can apply them to your strategies and win more bids. Architecture RFPs are essential as they meticulously outline the project requirements, helping firms showcase their expertise and align with client expectations.
Top RFP Statistics
Whether you’re a small enterprise or a large corporation, these insights will reveal the secrets to increasing your win rates and refining your proposal strategies. From trends in submission volumes to the impact of technology on bid success, we’ve gathered data that will change how you approach RFPs.
By gaining a deeper understanding of the most revealing and impactful RFP statistics, you can leverage this knowledge to give your team a competitive edge in your next proposal submission.
RFP Win Rates
- The average RFP win rate is 44% (360OM).
- In 2019, the win rates stood at 53%. By 2021, they had decreased to 44%, and this rate has remained consistent for the last two years (Loopio).
- 17% of teams report winning 30-39% of bids, while another 16% win 40-49% of their RFPs. A shocking 8% of teams report an 80-100% proposal win rate (OpenAsset).
- Enterprise and Mid-Market companies earn the highest win rates with 46% and 45% (Loopio).
- Smaller companies are still keeping up with a win rate of 42% (Magistral Consulting).
- Process satisfaction correlates with an 8% higher win rate (WebinarCare).
- Those who are satisfied with their process have a win rate of 48%, compared to 40% among those who are dissatisfied (WebinarCare).
- Small & Midsize companies, with 1 to 500 employees, saw a notable increase in their win rate, going from 38% last year to 42% this year (The RFP Queen).
- The average RFP advancement rate is 55% (The RFP Queen).
- Companies, on average, made it to the shortlist in 55% of cases, with this figure differing based on the size of the company. Enterprise teams lead with the highest advancement rates at 59%, while Mid-Market teams follow closely with a 56% advancement rate (Magistral Consulting).
RFP Stats Takeaway
These RFP win rate statistics indicate a dynamic and competitive landscape for AEC firms. The average win rate for RFPs has seen a decline from 53% in 2019 to a steady 44% over the past two years, suggesting an increase in competition or changes in bidding strategies.
While larger Enterprise and Mid-Market companies are slightly ahead with win rates of 46% and 45% respectively, smaller firms are not far behind, showing resilience with a 42% win rate. Notably, a small percentage of teams achieve exceptionally high win rates of 80-100%, highlighting the presence of highly successful players in the market.
The correlation between process satisfaction and an 8% higher win rate underscores the importance of efficient and effective bid processes.
Additionally, the advancement rate to the shortlist being 55% on average, with higher rates in larger companies, reflects the competitive nature of the industry, where a significant portion of bids are considered seriously but only a fraction convert into wins.
Overall, these statistics reveal a challenging yet opportunistic environment for AEC firms, where process optimization and company size play crucial roles in securing RFPs.
RFP Revenue
- On average, companies source 33% of their sales revenue through deals involving RFPs (cloudeagle).
- The sectors that derive the largest portion of their income from RFPs include Advertising, Media & Telecom, accounting for 46%, and Manufacturing, Supply Chain, Construction & Retail, contributing 40% to their revenue (WebinarCare).
- Revenue influenced by RFPs decreased by 8% from 2020 to 2024 (WebinarCare).
- The proportion of sales revenue derived from RFPs fell from 41% to 35%. This decline is not unexpected, given the disruptions in the buying cycle experienced during the pandemic (Loopio).
- In 2021, there was an additional 2% decrease in revenue influenced by RFPs. This decline may still reflect the lingering effects of the pandemic on economic activity, considering that many deals involving RFPs typically have extended sales cycles (WebinarCare).
- In 2021, 64% of survey participants noted a rise in the number of RFPs received, an increase from 2020, with the majority observing an approximately 30% surge in requests. Consequently, about 20% of RFPs go unfinished by companies annually, leading to an average revenue loss of $725,000 (QorusDocs).
- RFP-influenced revenue rose 6% between 2022 and 2023 (OpenAsset).
- In 2023, companies sourced 39% of their revenue from RFPs. Consistently over the past 4 years, we see RFx influence around 30-40% of company revenue (Bizcommunity).
RFP Statistics Takeaway
Request for Proposals (RFPs) play a significant role in the revenue generation of companies, influencing roughly 30-40% of their sales revenue consistently over the past four years.
Although there was an 8% decline in RFP-influenced revenue from 2020 to 2024, possibly due to pandemic-related disruptions in the buying cycle and longer sales processes, the sector remains a vital source of income for many businesses.
Notably, industries such as Advertising, Media & Telecom, Manufacturing, Supply Chain, Construction & Retail are heavily reliant on RFPs, deriving up to 46% and 40% of their revenue from them, respectively.
Despite the challenges, there was a reported increase in the volume of RFPs received in 2021 compared to 2020, with about 64% of respondents noticing a 30% increase in requests. However, the inability of companies to complete about 20% of these RFPs leads to significant revenue losses, averaging $725,000 annually.
Overall, RFPs remain a critical element in the business strategy of many companies, significantly impacting their revenue streams.
RFP Submissions
- Teams are responding to more RFPs this year – an average of 175 (Winning the Business).
- Teams that win more than 50% of their RFPs submit an average of 175 responses per year, as opposed to the average of 147. That’s 28 more RFPs per year, and all the more chances to win (G2).
- Typically, the volume of RFP submissions varies according to the size of an organization. Smaller organizations tend to respond to 72 RFPs per year, Mid-Market businesses handle about 162, and Enterprise companies significantly more, with an average of 273 RFPs annually (Loopio).
- Organizations equipped with an RFP tool tend to submit an additional 34 responses each year. Teams using RFP software average 179 RFP responses annually, in contrast to teams without such software, who manage only 145 responses (Loopio).
- A slight majority of organizations (51%) indicate intentions to raise the quantity of RFPs they will respond to in 2023. However, it’s important to highlight that this figure represents a 6% decrease from the previous year’s forecast of 57% (Loopio).
RFP Stats Takeaway
While the average annual submission rate is 162 RFPs, the volume varies significantly based on the organization’s size and use of RFP tools. Highly successful teams submit slightly more (163 annually) than the average, highlighting that a higher submission rate can correlate with better success, but the margin is slim.
Larger organizations and those using RFP tools tend to submit more proposals, with enterprise companies averaging 273 and those with RFP software submitting 179, compared to 145 for teams without such tools.
Despite a majority of organizations aiming to increase their RFP submissions in 2023, there is a notable decrease from the previous year’s intentions. This suggests that strategic priorities or resource allocations may be shifting.
Overall, the data indicates that while volume matters, efficiency and strategic focus are also crucial for RFP success.
RFP Response Times and Writing Times
- Organizations, on average, reply to 63% of the RFPs they receive (Loopio).
- The higher win rates achieved by enterprises appear to be linked to the greater amount of time they dedicate to crafting RFP Responses. On average, they invest 27 hours per RFP, compared to the 19 hours spent by SMBs (HubSpot).
- Given the large volume of responses that enterprises handle (266 per year), the extra 2 hours spent on each RFP significantly accumulate. As a result, enterprise companies on average dedicate 532 more hours annually to writing RFP responses compared to smaller firms (Loopio).
- The average time for writing a single RFP response is 32 hours or 25 minutes per question. This excludes the time required to evaluate the RFP, format the responses, or craft an effective proposal cover letter (Secureframe).
- 45% of RFPs are completed within a timeframe of 6–20 days (Loopio).
- 64% of small companies manage to submit their RFPs in 10 days or less, a factor that is reflected in their win rates (Loopio).
- Leading companies spend an average of 33 hours per RFP. Yet, the deviation of these top performers from the average becomes noticeable only when the writing time exceeds 41 hours, and even then, the variations are relatively slight (Loopio).
- On average, proposal professionals spend over 40 hours per week responding to an RFP (Responsive)
- Three-quarters of proposal teams that have fully integrated technology consistently complete their bids within the deadline (Responsive).
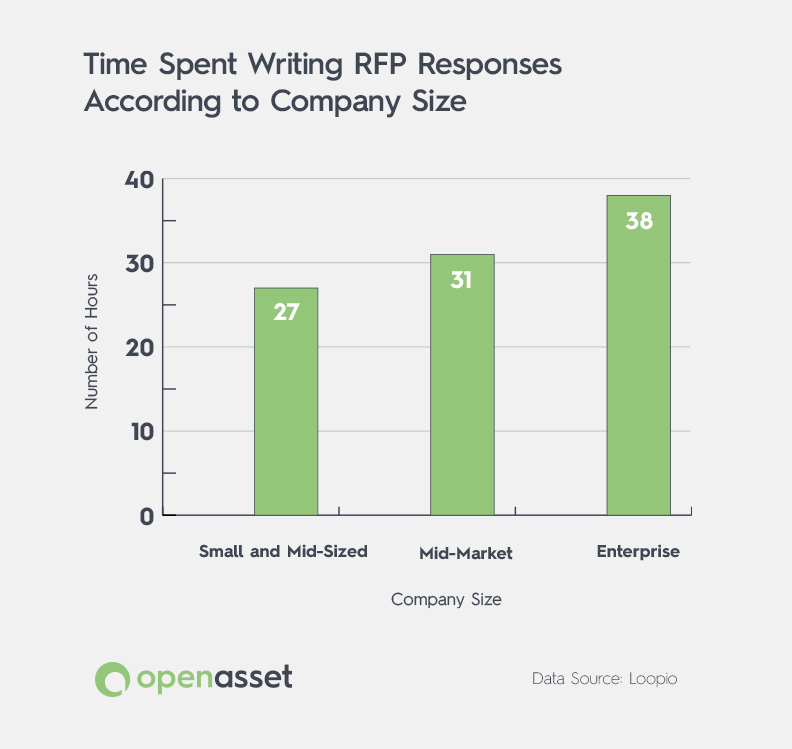
- Large organizations generally spend more time on RFP responses due to their larger team sizes. On average, small and mid-sized companies take 27 hours to write an RFP response. In contrast, Mid-Market organizations invest 31 hours, and Enterprise teams dedicate a substantial 38 hours to the writing phase of the proposal process (Loopio).
RFP Statistics Takeaway
Organizations responding to 63% of RFPs they receive suggest that most teams consider responding to about two-thirds of the bids they get as worthwhile. There is a clear link between time investment and success rates, particularly in larger organizations with enterprises investing more time per response (27 hours on average) compared to mid-market and SMBs. This results in a significant annual time commitment, especially for larger firms.
The overall average proposal writing time for a single RFP response is 32 hours, with 45% of RFPs completed within 6–20 days. Small companies often submit their RFPs in 10 days or less, positively affecting their win rates. Top-performing companies spend slightly more time on each RFP (33 hours), with a notable increase in time investment correlating with improved success.
Additionally, the use of technology is shown to help teams meet deadlines consistently. These findings underscore the importance of strategic time allocation in RFP responses and the effectiveness of technology in enhancing the RFP process.
RFP Software
- Teams that use software have an average 45% proposal win rate (DOCMO).
- On the other hand, teams that do not utilize software for their RFP processes have an average win rate of 41% (WebinarCare).
- 69% of organizations utilize an RFP tool or software (Winning the Business).
- Proposal teams using software report 14% more manageable stress levels (WebinarCare).
- 66% of enterprise companies report that they employ RFP response software to enhance their productivity and save time (Loopio).
- In 2021, 64% of companies utilizing proposal management software saw an increase in their business win rates compared to the previous year, with an average improvement of 59% (CloudTweaks).
- The main motivations for adopting an RFP solution include enhancements in content storage and management (64%), followed closely by time efficiency (60%), and the automation of repetitive, manual tasks (44%) (Loopio).
- Teams utilizing RFP software have an average annual influence on revenues of $405.2M, in contrast to those not using software, which influence $245.1M annually. This represents an average revenue increase of 65% (OpenAsset).
- Teams using RFP software submit an average of 46% more responses every year (Responsive).
- The majority of companies experience a return on investment (ROI) from RFP software in under a year. Remarkably, 42% of small companies report seeing ROI in less than six months (Loopio).
RFP Stats Takeaway
The use of specialized software significantly enhances the efficiency and effectiveness of RFP processes, leading to higher win rates and greater overall business success. Teams using RFP software achieve a higher average proposal win rate (45%) compared to those not using software (41%).
A substantial 69% of organizations utilize RFP tools or software, highlighting its widespread adoption and those teams submit an average of 46% more responses every year.
Benefits of using such software include 14% lower stress levels in proposal teams, time savings, productivity enhancement, and improved content management.
66% of enterprise companies use RFP software mainly for these reasons. Additionally, in 2021, 64% of companies using proposal management software reported a notable increase in their win rates, averaging a 59% improvement.
The software also positively impacts revenue, with teams using it influencing an average of $405.2M annually, a significant increase compared to non-software users.
Moreover, most companies report experiencing a return on investment in less than a year, with 42% of small companies seeing ROI in under six months. These points collectively underscore the value of RFP software in enhancing proposal management, increasing win rates, and driving revenue growth.
RFP Collaboration
- A significant 85% of users of proposal management software agree that it facilitates easy collaboration when handling a request (WebinarCare).
- A survey revealed that companies utilizing proposal management software experienced a remarkable 56% improvement in collaboration on RFPs (CloudTweaks).
- Recommendations for enhancing the RFP process emphasize better collaboration and content management (RocketDocs).
- Respondents of a survey suggested that to increase RFP wins in 2023, SMEs should focus on responding to requests more promptly (33%), enhancing content discovery and maintenance (29%), and streamlining their processes (28%) (Loopio).
RFP Statistics Takeaway
Using platforms that facilitate team collaboration can enhance your rate of response. Proposal management software plays a crucial role in facilitating effective collaboration and improving the RFP process. A vast majority (85%) of software users agree that it significantly eases collaboration efforts during request handling.
Additionally, companies that use proposal management software report a substantial 56% improvement in collaboration on RFPs, underscoring the software’s impact on team dynamics and efficiency.
The emphasis in RFP process enhancement is on better collaboration and content management, indicating that these are pivotal areas for improving overall RFP success. These points collectively highlight that effective collaboration, facilitated by the right software and process improvements, is essential for RFP success, particularly in enhancing response quality and efficiency.
RFP Challenges
- 63% of AEC marketers said they struggle to manage the digital assets (images, brand material, videos, etc) they need to provide a consistent brand image across multiple channels (OpenAsset).
- Collaborating with internal experts remains the top challenge in the response process (VendorfulAI).
- RFP teams identify their main challenges as collaborating with subject-matter experts (51%), locating current and accurate responses (42%), adhering to deadlines and managing delays (35%), and possessing sufficient capacity to respond to all RFPs (32%) (Loopio).
RFP Stats Takeaway
Managing the RFP process presents several significant challenges for sales teams and RFP teams alike, particularly in terms of administration and collaboration. A notable 45% of sales teams report that their primary challenges stem from burdensome administrative tasks, including manual data entry.
Furthermore, the most pressing issue during the response process is collaborating with internal experts. RFP teams specifically cite their main challenges as coordinating with subject-matter experts (51%), finding up-to-date and accurate responses (42%), meeting deadlines and handling delays (35%), and having enough capacity to address all RFPs (32%).
These points collectively underscore the complexities involved in the RFP process, highlighting the need for efficient collaboration, effective time management, and streamlined administrative procedures to overcome these challenges.
RFP Volume
- Top-performing teams, achieving more than 51% success in RFP bids, tend to submit a greater number of RFP responses annually (HubSpot).
- Enterprises frequently encounter difficulties with the capacity to manage high RFP volumes, with 34% identifying this as a challenge (Loopio).
- In 2021, 64% of participants observed an increase in RFPs received, compared to 2020, often encountering around a 30% surge in requests (QorusDocs).
- About 25% of businesses believe they would benefit from more proactive engagement in seeking RFPs to bid on (The Bid Lab).
RFP Statistics Takeaway
Managing a high volume of RFPs is both a factor in achieving success and a significant challenge for organizations. Top-performing teams, who have over a 50% success rate in RFP bids, typically handle a larger number of RFP responses annually, suggesting that higher submission volumes may contribute to greater success rates.
However, enterprises often struggle with the capacity to manage this high volume of RFPs, with 34% citing it as a challenge. This indicates that while submitting more RFPs can lead to more wins, it also requires sufficient resources and strategies to handle the increased workload effectively.
The year 2021 saw a noticeable increase in the volume of RFPs received by 64% of participants, with many experiencing a 30% rise in requests compared to 2020. This surge in RFP volume underscores the growing demand and competitive nature of RFP bidding.
Additionally, about 25% of businesses recognize the potential benefits of being more proactive in seeking RFPs to bid on. This proactive approach could be a strategy to increase opportunities, though it also implies the need for efficient management of the resulting higher RFP volume.
Overall, these points highlight the importance of balancing the number of RFPs an organization can effectively manage with the pursuit of increased opportunities for business growth.
RFP Training
- Companies plan to invest in team training, hiring, and tech in 2023 (Loopio).
- In 2023, the primary focuses for investing resources in RFPs are enhancing team training (46%), expanding staff (41%), and adopting new technology (33%) (Loopio).
- Moving into 2024, these priorities slightly shift with team training still leading at 44%, followed by increasing staff (41%), and a greater emphasis on new technology investment (40%) (WebinarCare).
- Sales teams engaging in a minimum of three hours of training or coaching monthly exceed their goals by 7%, increase revenue by 25%, and boost their win rates by 70% (SuperOffice).
RFP Stats Takeaway
There is a growing emphasis companies are placing on investing in team training, expanding staff, and adopting new technology to enhance RFP outcomes. In 2023, the focus is predominantly on team training (46%), staff increase (41%), and technology adoption (33%), with a similar trend continuing into 2024, albeit with a slightly greater emphasis on new technology (40%).
Importantly, regular training has a significant positive impact, with sales teams that engage in at least three hours of training monthly exceeding their goals by 7% and increasing their win rates by 70%. This highlights the direct benefits of continuous training and development in improving RFP success.
Proposal Professionals Salaries
- The typical salary for proposal-related positions, including writers and managers across various experience levels, is nearly $89,800 (USD), with the majority of these salaries ranging from $51,000 to $125,000 (Loopio).
- On average, proposal managers earn $99,490 (ZipRecruiter).
RFP Statistics Takeaway
These statistics make it clear that this field offers competitive compensation across various roles and experience levels. The average salary for proposal-related positions, encompassing both writers and managers, is approximately $89,800 (USD), with a common salary range extending from $51,000 to $125,000.
Specifically, proposal managers earn an average of $92,851, indicating a slightly higher pay scale within the spectrum of proposal-related roles. This data suggests that careers in proposal management and writing are financially rewarding, reflecting the value and skill required in these positions.
| TIP: with 63.2% of marketing teams dedicating more than half of their time to proposals, it’s crucial to understand where bottlenecks exist and how to optimize your workflow. Download The State of Proposals in AEC Marketing Report now and take the first step towards improving workflows and overall proposal strategy. |
Winning More Bids With OpenAsset
OpenAsset is a key tool in enhancing RFP win rates and streamlining the bidding process. This Digital Asset Management (DAM) solution effectively addresses common challenges in the RFP landscape, such as improving collaboration, managing proposal volumes, and optimizing content quality.
With OpenAsset, teams can focus more on strategic aspects of RFPs rather than administrative burdens, leading to higher win rates and greater team satisfaction.
The integration of OpenAsset streamlines workflows and enhances decision-making, making it a vital resource for teams of various sizes. It supports continuous learning and adaptability, key elements in today’s competitive proposal environment.
Investing in OpenAsset’s DAM software not only improves current RFP processes but also positions teams for future success, turning proposals into opportunities for growth and achievement. Ready to win more business with OpenAsset?
Landon Iannamico is a content marketing expert with 6 years of experience helping B2B SaaS brands tell their stories and establish their verbal identities. He specializes in crafting brand narratives and producing content that breaks down complex concepts for highly specific, knowledgeable audiences across the data, AI, and engineering industries.